June and early July are important months in terms of field crop disease development. For diseases such as sclerotinia stem rot of canola and ergot of small grain cereals, suitable pathogen development must occur to produce spores before host infection can take place. The pathogens associated with both diseases overwinter as resting bodies known as sclerotia, which are compact masses of hyphae (Figure 1). Germination of stem rot sclerotia to produce the golf-tee shaped apothecia, aka carpogenic germination, requires suitable moisture conditions and moderate temperatures
- Typically, sclerotial germination takes up to three weeks with the occurrence of temperatures that range from 10 to 20oC and suitable moisture conditions
- Soil surface moisture levels at or close to field capacity are needed for germination of sclerotia, although some germination can occur when levels are somewhat less that field capacity
- Field capacity varies depending on soil texture but is generally around 20% soil moisture (volumetric water content [VMC], aka percent saturated soil) for sandy soils, while for heavier textured soils this can range up to 40% soil moisture
PCDMN weekly soil moisture maps
The PCDMN has been working with Agriculture and Agri-Food Canada (AAFC) to obtain maps showing surface soil moisture based on satellite observations. These soil moisture values are in VMC and usually range from 5-45% by volume and the relationship between this value and the plant available water are affected by soil texture. For example, a sandy soil may have a volumetric moisture content as low as 5% when dry, whereas the lower bounds for a clay textured soil may be closer to 20% VMC. Soils with a VMC of 40-60% would be wet/saturated, although the level of saturation would vary based on soil texture, where a sandy soil may be saturated at 30% compared to 40-60% for heavier textured or organic soils.
The data are produced by the European Space Agency from passive microwave satellite data collected by the Soil Moisture and Ocean Salinity (SMOS) satellite and converted to soil moisture using the SMOS soil moisture processor. Satellites are used to sense the strength of radiation emitted from the surface of the earth. There is a strong difference in the signals emitted by dry soil and wet soil. This relationship is used to calculate surface soil moisture using a model that incorporates land cover, vegetation content, surface roughness, soil texture and other factors that influence the satellite sensor. The satellite collects data every one to three days over Canada (Satellite Soil Moisture – agriculture.canada.ca).
Figure 2 presents weekly soil moisture levels (averaged for July 5-13, 2025) in the top five centimeters of soil in western Canada.
- In the first 2025 PCDMN soil moisture update dry conditions were reported to have occurred during the first half of June with large areas having less than 15% VMC
- However, as of June 22, rainfall during the latter half of June had increased VMC in many Prairie regions, including the Peace region, the Edmonton and central Alberta region, central to northern cropping areas of Saskatchewan and northern cropping areas of Manitoba (July 2, 2025 update)
- Volumetric water contents of >20% occurred in central to northern areas of Saskatchewan and west of Edmonton down towards Calgary in Alberta as of June 28, 2025
- In the second 2025 PCDMN soil moisture update, based on soil moistures from June 30-July 6, large areas of the Prairies have <15% VMC, although some northern cropping areas in central Manitoba have levels of up to 35-40% VMC
- There were also areas along the northern extent of agriculture in Manitoba, Saskatchewan and Alberta (e.g. north Peace River region) where VMC levels reached up to 20%
- Based on soil moisture levels from July 5-13, 2025, large areas of the Prairie region still have <15% VMC, while there are only a few isolated areas that have VMCs of up to 35-40% VMC (Figure 2)
- Note over the week of July 7-13, 2025 some rainfall has occurred, mainly in the 6 to 23 mm of rainfall range (Figure 3). This was mainly in the Edmonton to Calgary region and east across central Alberta. In Saskatchewan the rainfall was mainly in southwestern areas, and across central to west central areas of the province. Manitoba generally had levels of less that 11 mm during this period. The driest areas tended to be in the Peace River region and across the northern areas of agriculture production in Alberta and Saskatchewan and northwestern Manitoba.
Prairie canola growth stages for 2025 are variable depending on the Province, region, and seeding date. In many regions crops are well into flowering, while later seeded crops are moving into flowering.
- Overall, fields in areas with VMC levels of >15-20% that started to occur as of June 22, 2025 may start to see the appearance of apothecia. However, soil moisture maps for June 30-July 6, 2025 and July 5-13, 2025 indicate that most of the Prairie region still have soils with <15% VMC, which is not conducive to sclerotial germination
- Note, localized weather systems (e.g. thunderstorms) may increase the risk for specific fields so in-crop scouting is always advised
- As of July 16, 2025, most canola crops are now flowering with more advanced fields moving from mid bloom to the full bloom stages. Growers in areas with >15-20% VMC (Figure 2) are encouraged to scout fields for apothecia of the stem rot fungus and to assess in-field stem rot risk. Scouting is especially important where crop canopies have covered the soil surface for at least 2-3 weeks
- In 2006, the Canola Council of Canada and Agriculture and Agri-Food Canada co-developed a canola disease identification card that includes examples of typical stem rot pathogen apothecia along with other fungal fruiting structures that are not stem rot apothecia (see Figure 4 below)
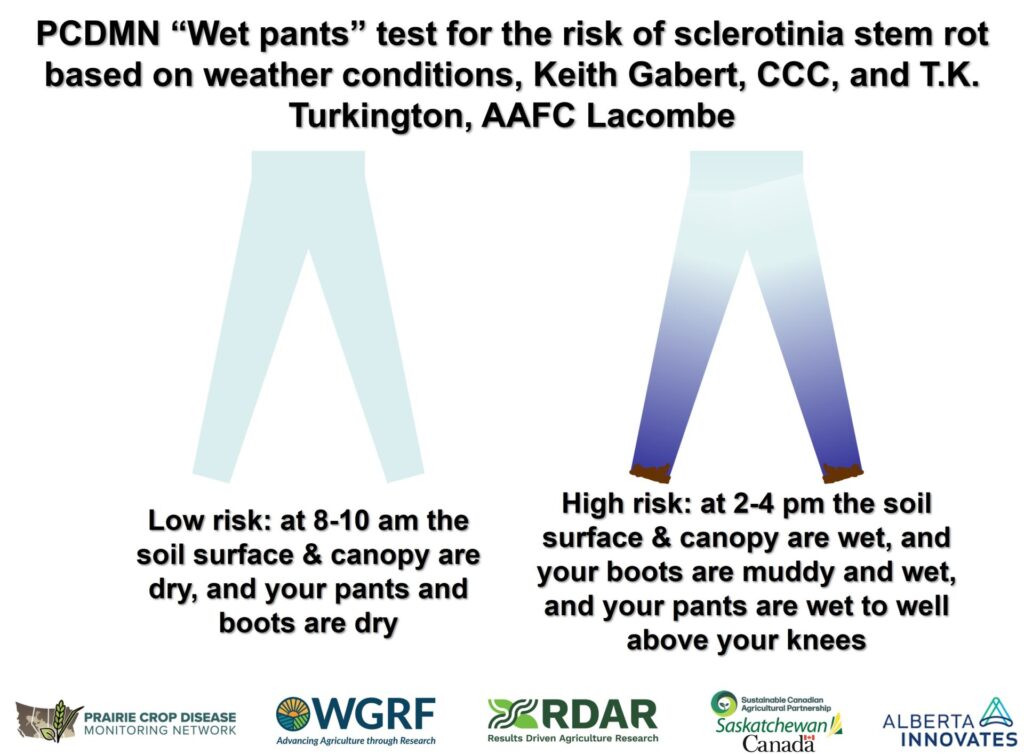
- Another straight-forward option to gauge the favourability of the weather and canopy microenvironment for sclerotial germination and risk of stem rot is the “wet-pants test” (Figure 5)
- If you are scouting your field at 8-10 am in the morning and the soil surface is dry and the crop canopy is dry, this would represent canopy microenvironmental conditions that ARE NOT conducive to sclerotial germination and apothecia production, and infection of plants from ascospore-contaminated petals
- Under these conditions it is likely not worthwhile to spray a fungicide, but further scouting should be done as your canola crop progresses to the full bloom stage. In addition, also look at what the other risk assessment tools are indicating in terms of stem rot risk
- Conversely, if you are out in the crop towards late afternoon and the soil surface is very wet, your boots are muddy and your pants are wet to the knees and upwards, this would would represent canopy microenvironmental conditions that ARE conducive to sclerotial germination and apothecia production, and infection of plants from ascospore-contaminated petals
- Under these conditions spraying a fungicide may be worthwhile, especially if the other stem rot risk tools indicate a moderate to high risk
- If you are scouting your field at 8-10 am in the morning and the soil surface is dry and the crop canopy is dry, this would represent canopy microenvironmental conditions that ARE NOT conducive to sclerotial germination and apothecia production, and infection of plants from ascospore-contaminated petals
- In these higher risk areas (VMC >15-20%) in-crop scouting for apothecia and the use of available stem rot risk assessment tools are recommended over the next 1-3 weeks as part of fungicide use decisions (Figure 2, July 2, 2025 update, July 9, 2025 update)
- Tools such as the petal testing services (Service 1 and Service 2) can provide guidance related to the level of sclerotinia inoculum and stem rot risk as the crop starts flowering
- Note these need to be combined with other risk tools to provide a complete picture of stem rot risk in relation to host, pathogen and environment factors, i.e. the disease triangle
- Petal testing can be useful to demonstrate changes in aerial spore loads as crops move from very early bloom to full bloom
- Previous research has shown that petal infestation levels with the stem rot pathogen can change substantially (e.g. >80-90%) during flowering
- These changes along with variation in canopy moisture conditions can impact the relative importance of early versus full bloom fungicide timings
- Previous research has shown that petal infestation levels with the stem rot pathogen can change substantially (e.g. >80-90%) during flowering
- If fungicides are being considered, accounting for the most common crop growth stage in a field should be considered to help guide the timing(s) used
- Fortunately, most fungicide products have a window from 20-50% bloom, which represents a range of growth stages. Note available risk assessment tools will provide guidance related to stem rot risk and whether a fungicide is needed from 20-50% bloom
- On June 26, 2024, a new web-based tool from the Canola Council of Canada was announced that considers host, pathogen and weather related stem rot risk factors as well as a component that evaluates ROIs based on input costs, projected yields and commodity price. More information on the tool can be found at the Canola Council of Canada, along with the online tool itself
- The Canola Council of Canada’s seasonal Canola Watch series provides timely information in terms of sclerotinia risk assessment and fungicide timing
Depending on rainfall conditions over the next 1-3 weeks there may be an increase in sclerotial germination and ascospore production and thus there may be concerns regarding the risk this may represent for crops progressing from full to late bloom.
- In general, yield losses due the sclerotinia stem rot are highest when the crop becomes infected earlier in the flowering period, although losses can be significant up to full bloom
- With earlier infections there is a greater potential for main stem and branch infections to occur thus affecting a greater proportion of the canola plant. Here clumping of infested petals on the leaf blades and leaf and branch axils (Figure 6) have a greater potential to progress into the main stems and branches thus having a larger impact on movement of water, nutrients and/or photosynthates during pod filling
- M.Sc. research in the 1980s by Sheldon Rude at the University of Saskatchewan showed that when infections occur at late bloom yield losses are lower versus infections that occur earlier
- For example, Sheldon found that when increased aerial spore loads (as measured by agar plate petal testing) only occurred at late bloom, yield losses were only 8% in a field trial. This is in contrast to the typical yield losses of 20-40% when inoculum loads and infections occur from early to full bloom
- Factors that may contribute to lower yield losses when infections occur as the crop progresses into late bloom include:
- Increasing leaf abscission in the lower canopy, which removes a potential route for hyphae of the stem rot fungus to grow from clumped infested petals on leaves through the leaf petioles and into the main stems and branches
- Reduced production of petals that can be infested and thus act as a food-base for plant infections
- Increased hardiness of stem tissues at late bloom may slow down progression of stem infections. Sheldon Rude found that lesion length was shorter when plants were inoculated at late bloom versus full bloom
- Finally, towards late bloom there can be a greater potential for infested petals to be caught and clump on developing pods and upper canopy tissues, and these infections have less potential to impact grain filling for the entire plant
For information on sclerotinia stem rot fungicide options, timings, and pre-harvest intervals consult local Provincial crop protection guides (AB Guide, SK Guide, MB Guide) and always follow label recommendations.
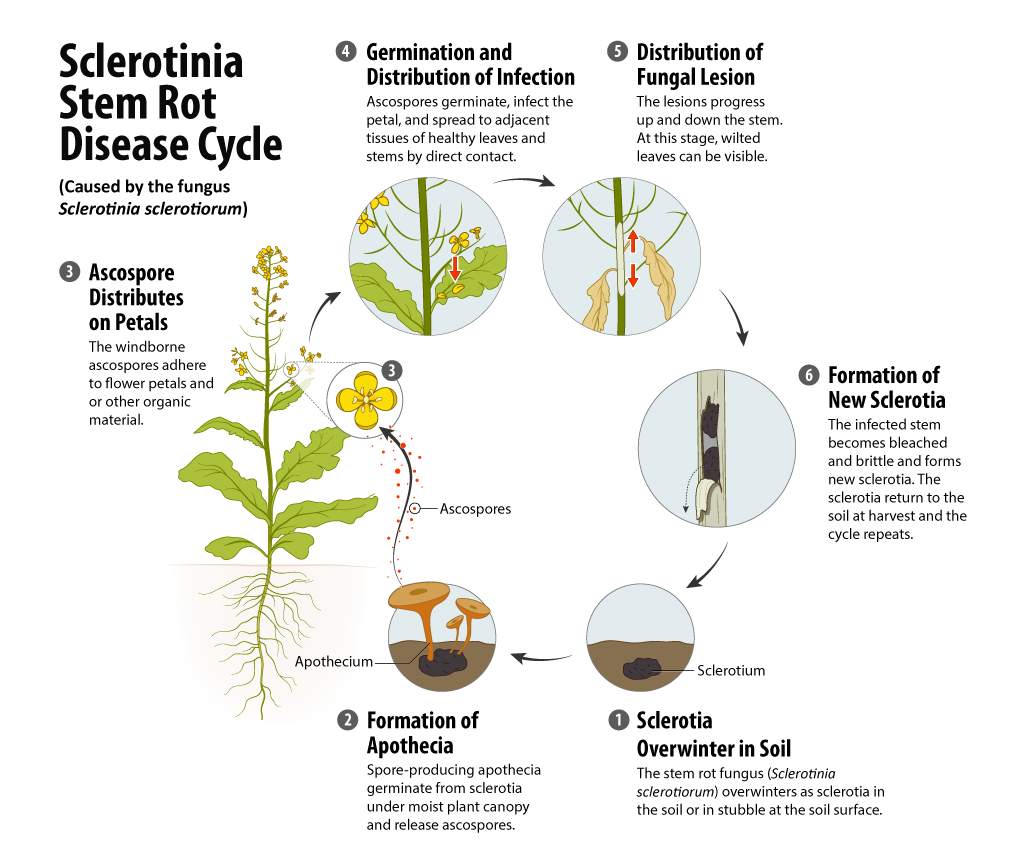
Figure 1. Disease cycle of sclerotinia stem rot of canola. Courtesy of Taryn Dickson, Resource Manager, Crop Production and Innovation and the Canola Council of Canada
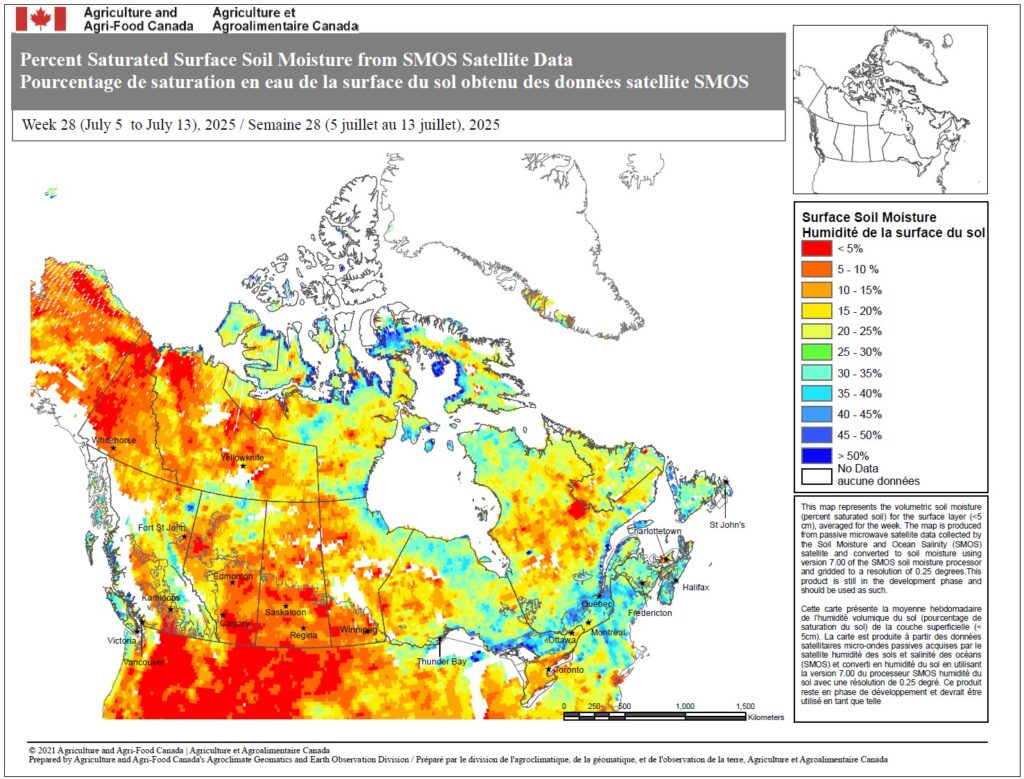
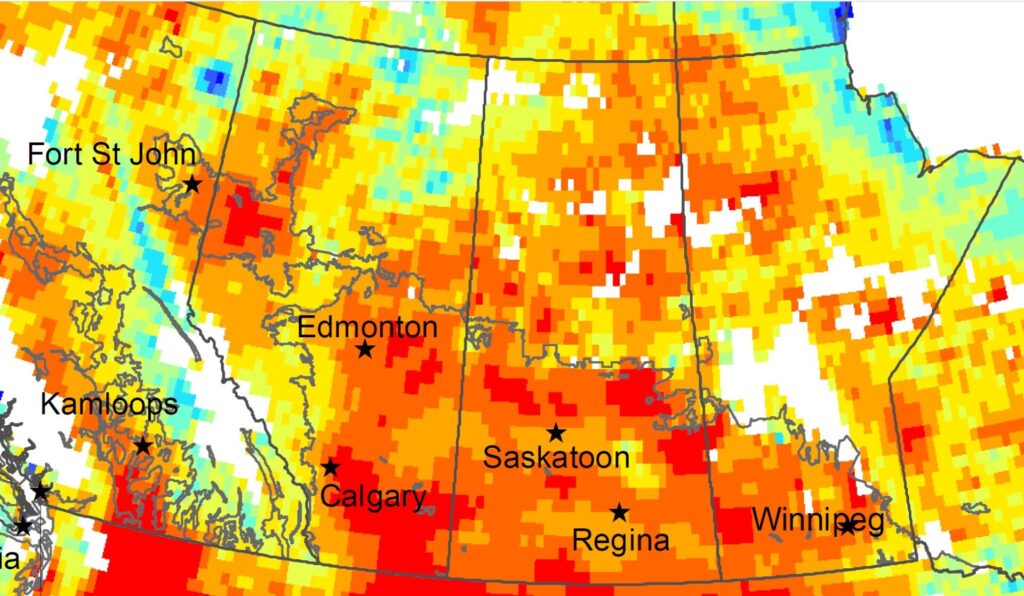
Figure 2. Percent saturated surface soil moisture (volumetric soil moisture, VMC) from SMOS satellite data, July 5-13, 2025. Courtesy of Agriculture and Agri-Food Canada’s Science and Technology Branch, AAFC Geomatics
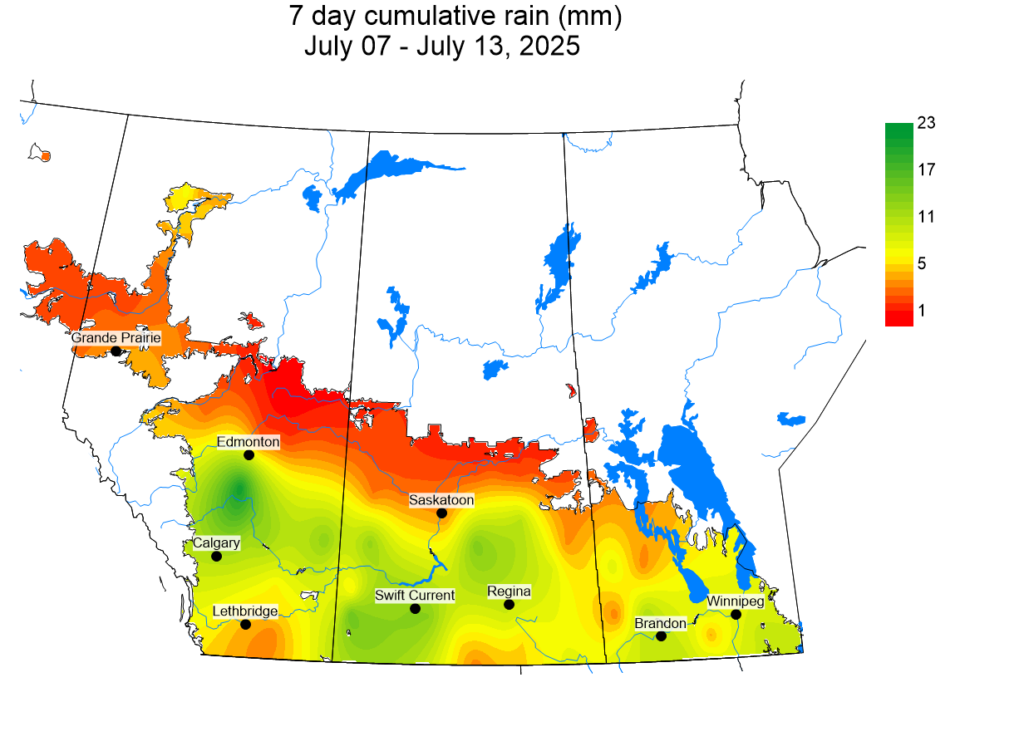
Figure 3. Seven day rainfall totals (mm) for July 7-13, 2025
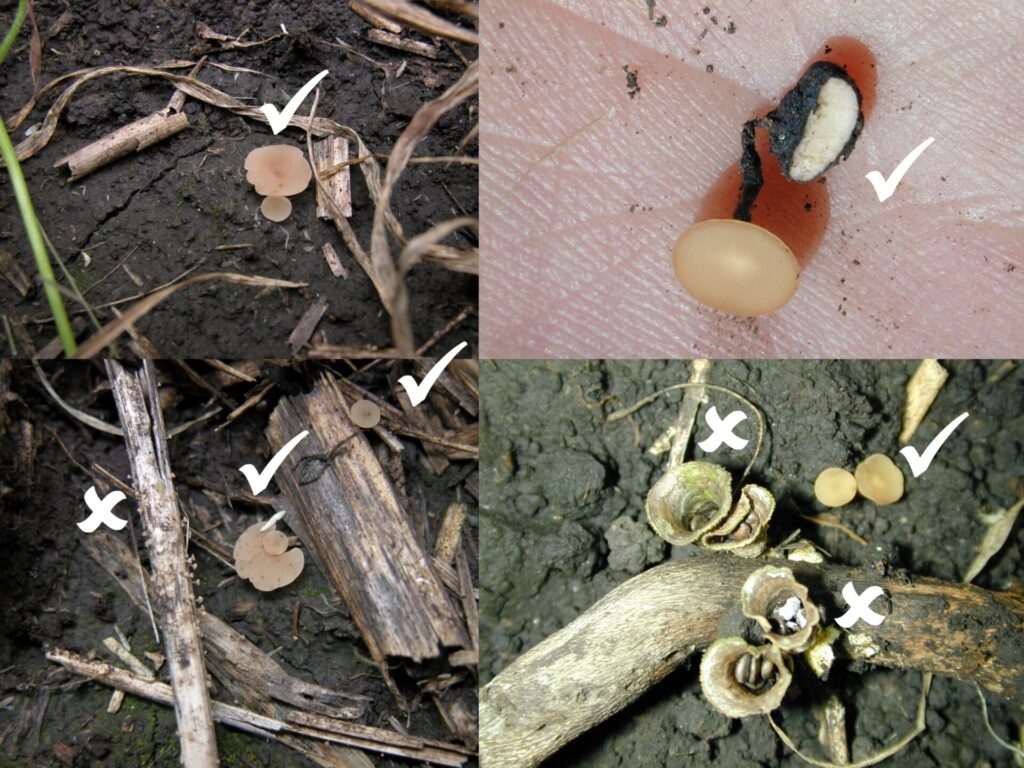
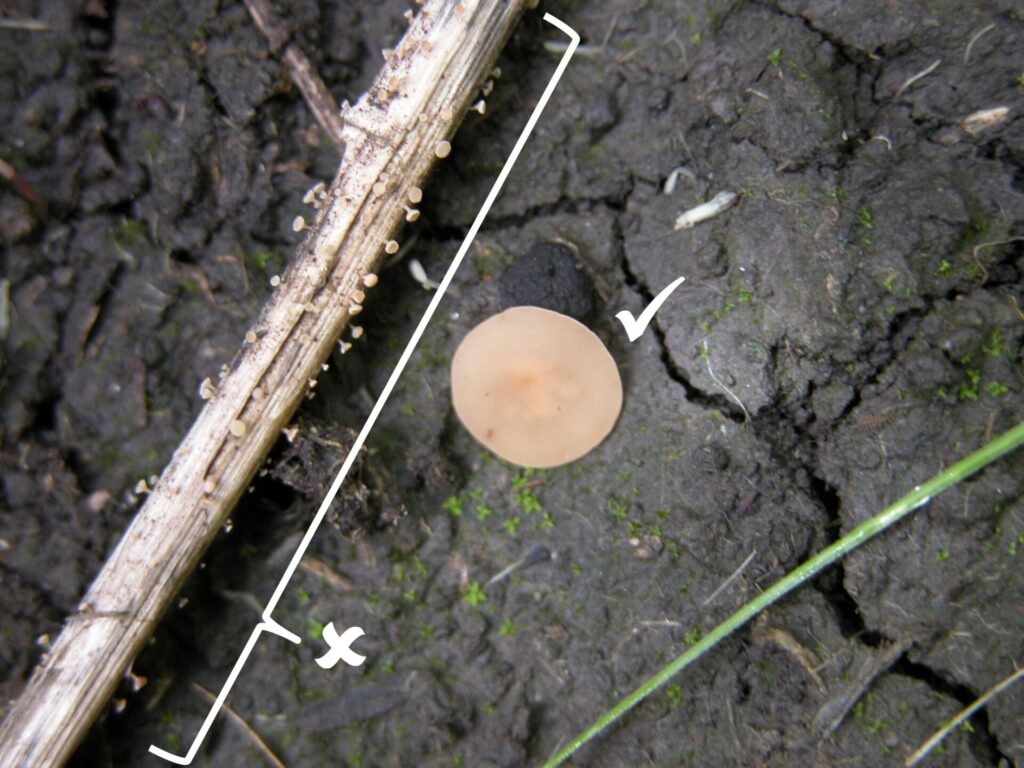
Figure 4. Typical apothecia of the sclerotinia stem rot pathogen of canola (white “check” marks) versus other fungal fruiting structures that are not stem rot apothecia (white “X” marks)
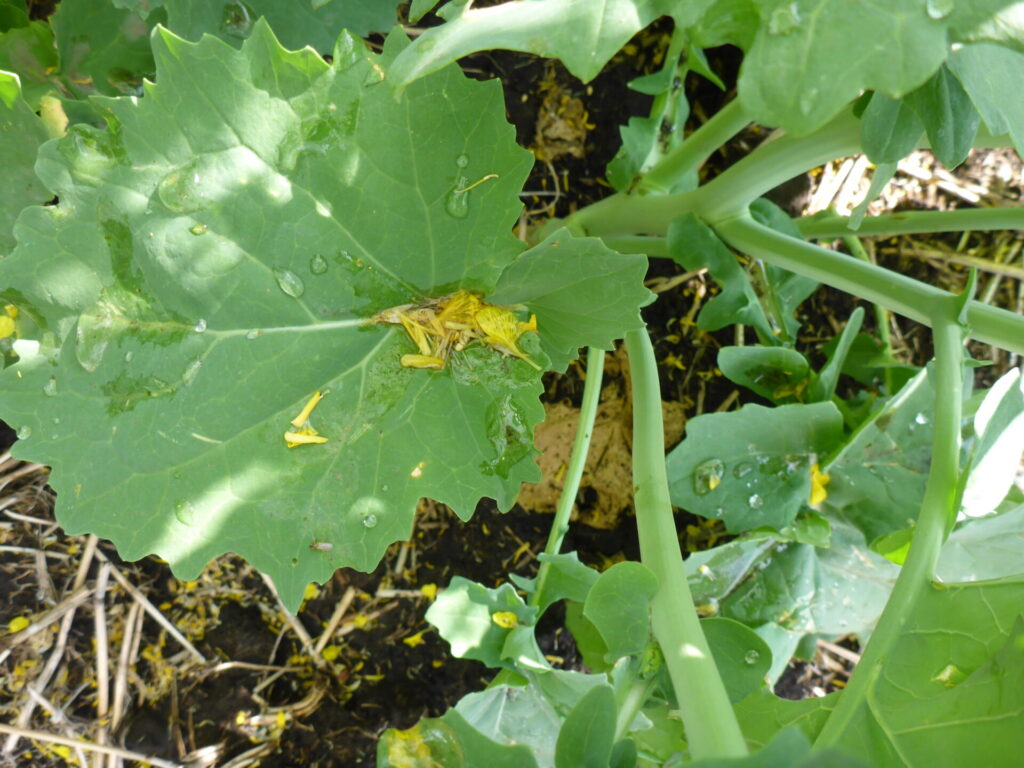
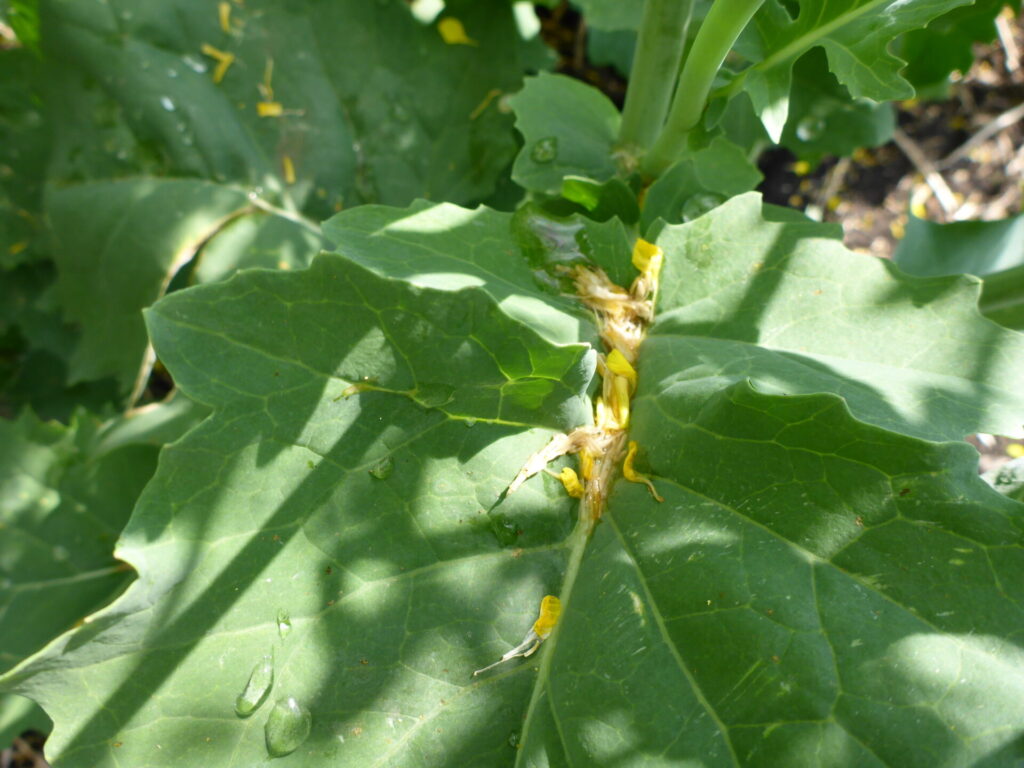
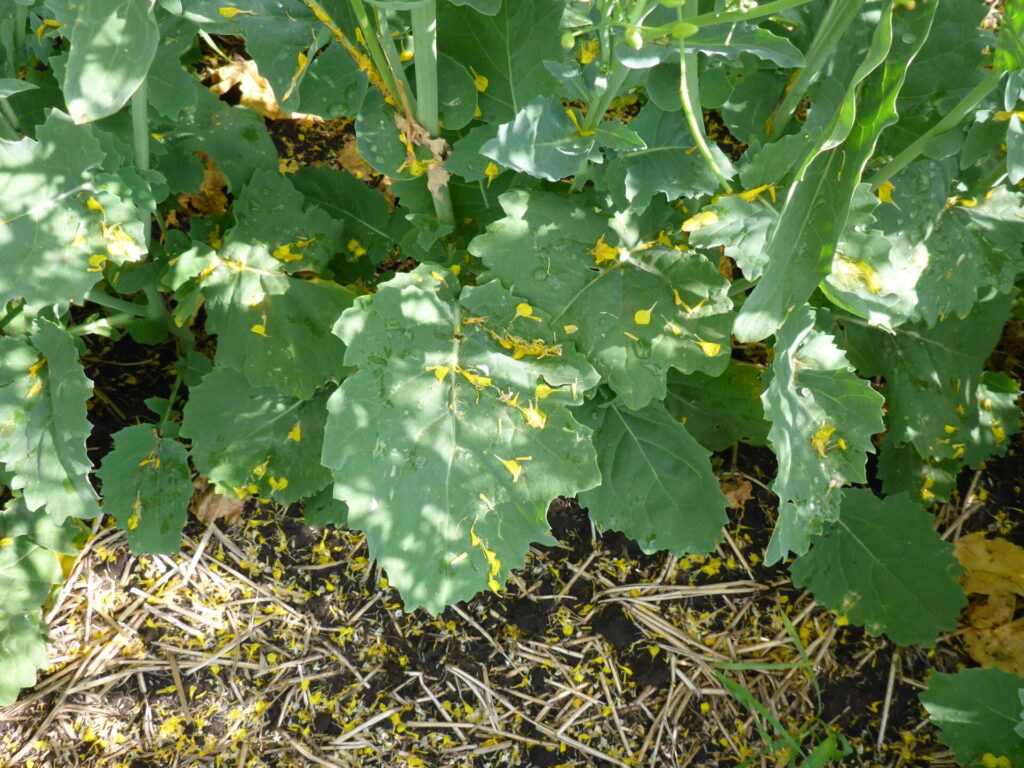
Figures 6a-c. Examples of petal clumping in canola