June and early July are important months in terms of field crop disease development. For diseases such as sclerotinia stem rot of canola and ergot of small grain cereals, suitable pathogen development must occur to produce spores before host infection can take place. The pathogens associated with both diseases overwinter as resting bodies known as sclerotia, which are compact masses of hyphae (Figure 1). Germination of stem rot sclerotia to produce the golf-tee shaped apothecia, aka carpogenic germination, requires suitable moisture conditions and moderate temperatures:
- Typically, sclerotial germination takes up to three weeks with the occurrence of temperatures that range from 10 to 20oC and suitable moisture conditions
- Soil moisture levels at or close to field capacity at the soil surface are needed for germination of sclerotia, although some germination can occur when levels are somewhat less that field capacity
- Field capacity varies depending on soil texture but is generally around 20% soil moisture (volumetric water content [VMC], aka percent saturated soil) for sandy soils, while for heavier textured soils this can range up to 40 % soil moisture
PCDMN weekly soil moisture maps
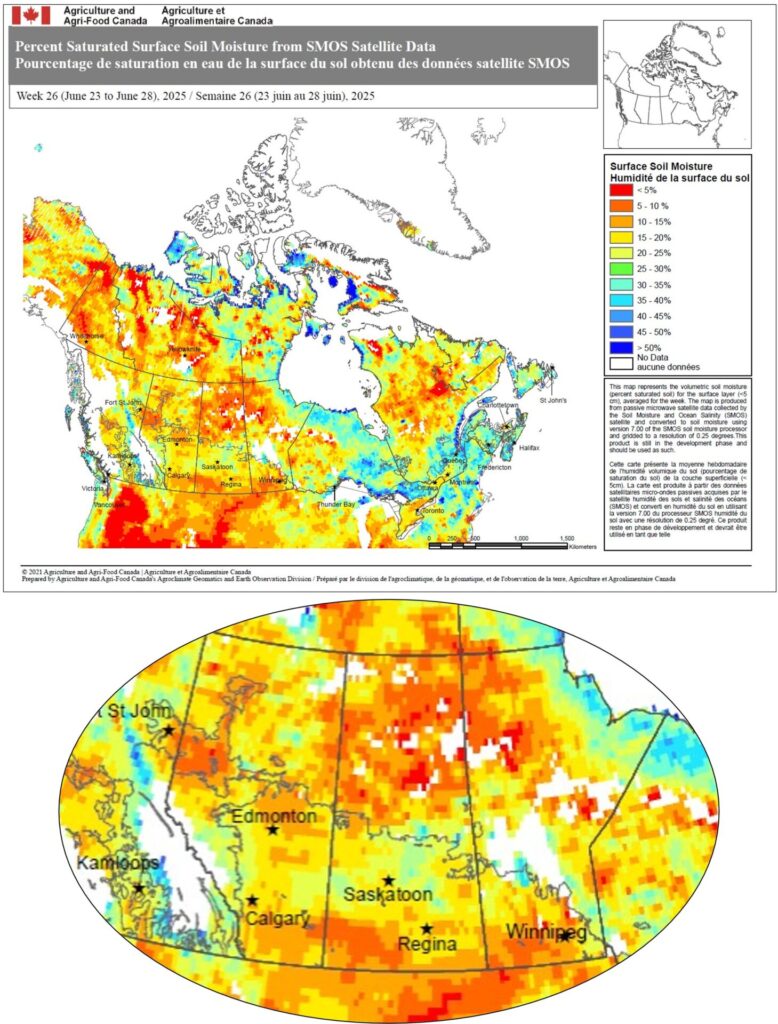
The PCDMN has been working with Agriculture and Agri-Food Canada (AAFC) to obtain maps showing surface soil moisture based on satellite observations. These soil moisture values are in VMC and usually range from 5-45% by volume and the relationship between this value and the plant available water are affected by soil texture. For example, a dry sandy soil may have a volumetric moisture content as low as 5% when dry, whereas the lower bounds for a clay textured soil may be closer to 20% VMC. Soils with a VMC of 40-60% would be wet/saturated, although the level of saturation would vary based on soil texture, where a sandy soil may be saturated at 30% compared to 40-60% for heavier textured or organic soils.
The data is produced by the European Space Agency from passive microwave satellite data collected by the Soil Moisture and Ocean Salinity (SMOS) satellite and converted to soil moisture using the SMOS soil moisture processor. Satellites are used to sense the strength of radiation emitted from the surface of the earth. There is a strong difference in the signals emitted by dry soil and wet soil. This relationship is used to calculate surface soil moisture using a model that incorporates land cover, vegetation content, surface roughness, soil texture and other factors that influence the satellite sensor. The satellite collects data every one to three days over Canada (Satellite Soil Moisture – agriculture.canada.ca).
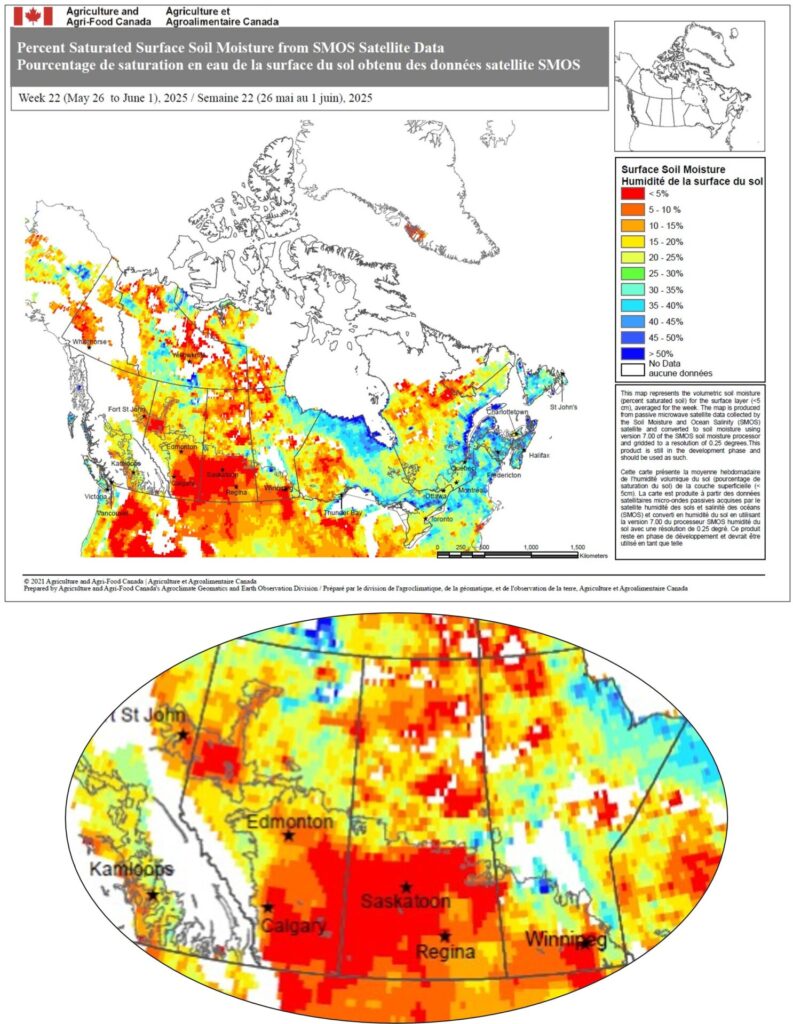
Figures 2-6 present data for weekly soil moisture levels (averaged for June 1-28, 2025) in the top five centimeters of soil in western Canada.
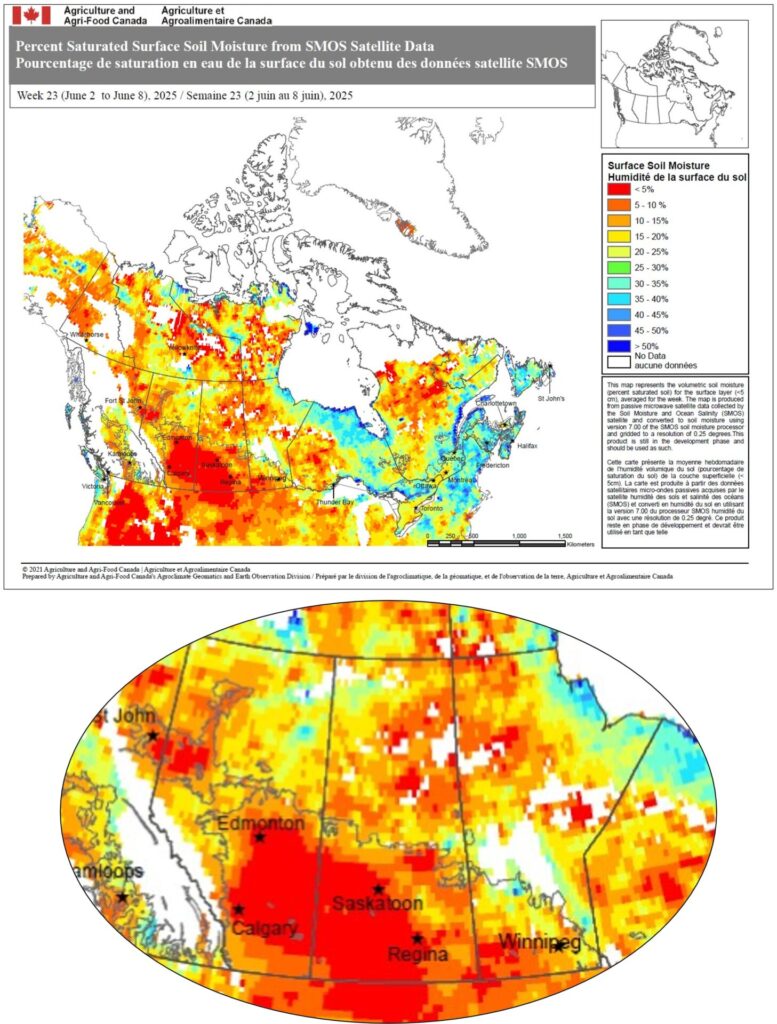
- As of June 1 and 8, 2025 weekly VMC (% saturated soil) at the soil surface (< 5 cm) was less than 10% for large areas of the Prairies from the Peace Region and Edmonton region to southern Alberta, much of the cropping area of Saskatchewan, and for large areas of central to southern Manitoba (Figures 2 and 3)
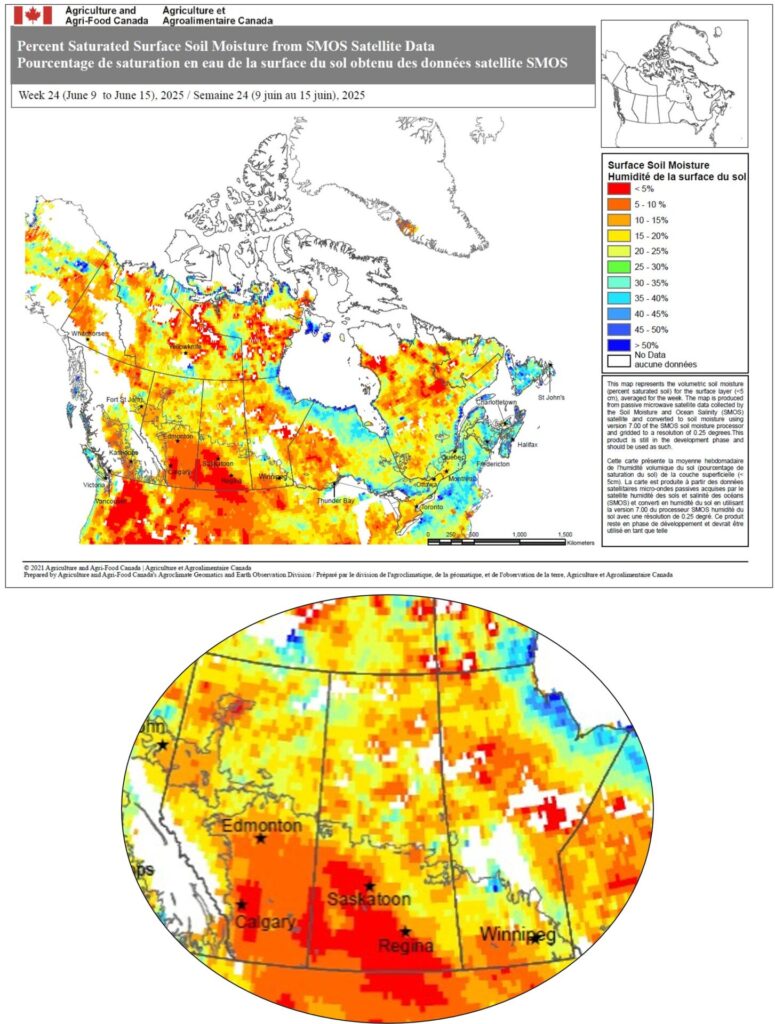
- Dry conditions in many of these regions persisted into mid-June with VMC levels <15% (Figure 4). However, there were some areas with >15% VMC, especially in northern cropping areas of Manitoba, and parts of eastern Saskatchewan
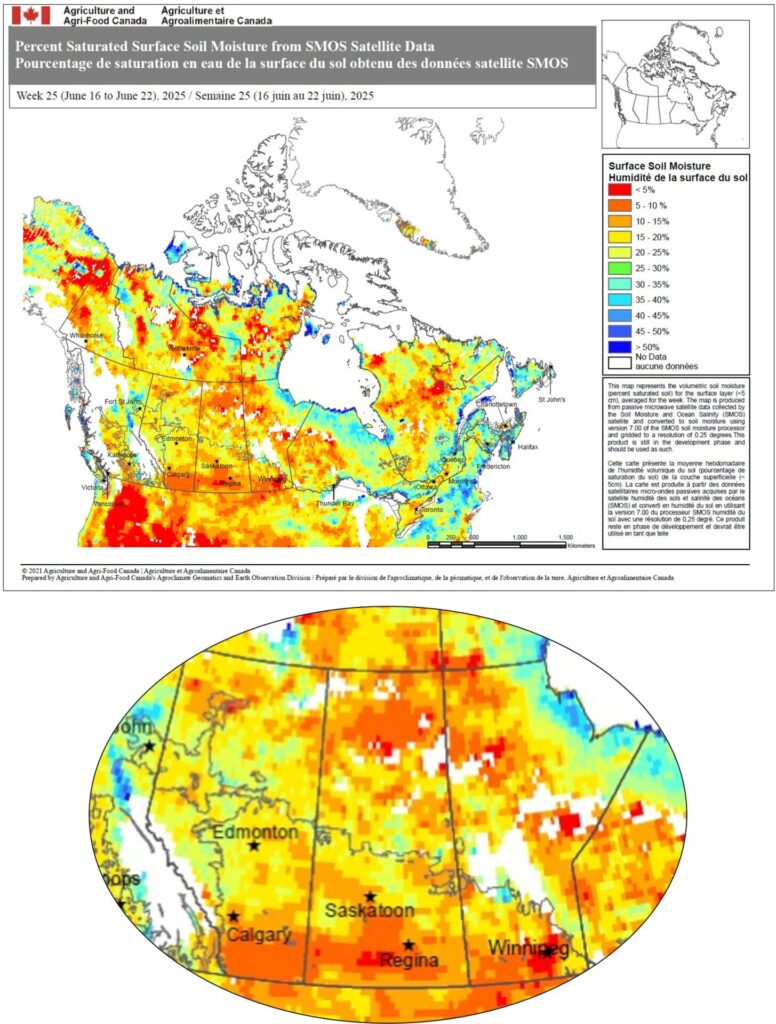
- As of June 22, rainfall during the latter half of June has increased VMC in many Prairie regions, including the Peace region, the Edmonton and central Alberta region, central to northern cropping areas of Saskatchewan and northern cropping areas of Manitoba (Figure 5)
- Similar patterns were observed as of June 28, 2025, although VMCs in the Peace region were generally <15% (Figure 6)
- Volumetric water contents of >20% occurred in central to northern areas of Saskatchewan and west of Edmonton down towards Calgary in Alberta
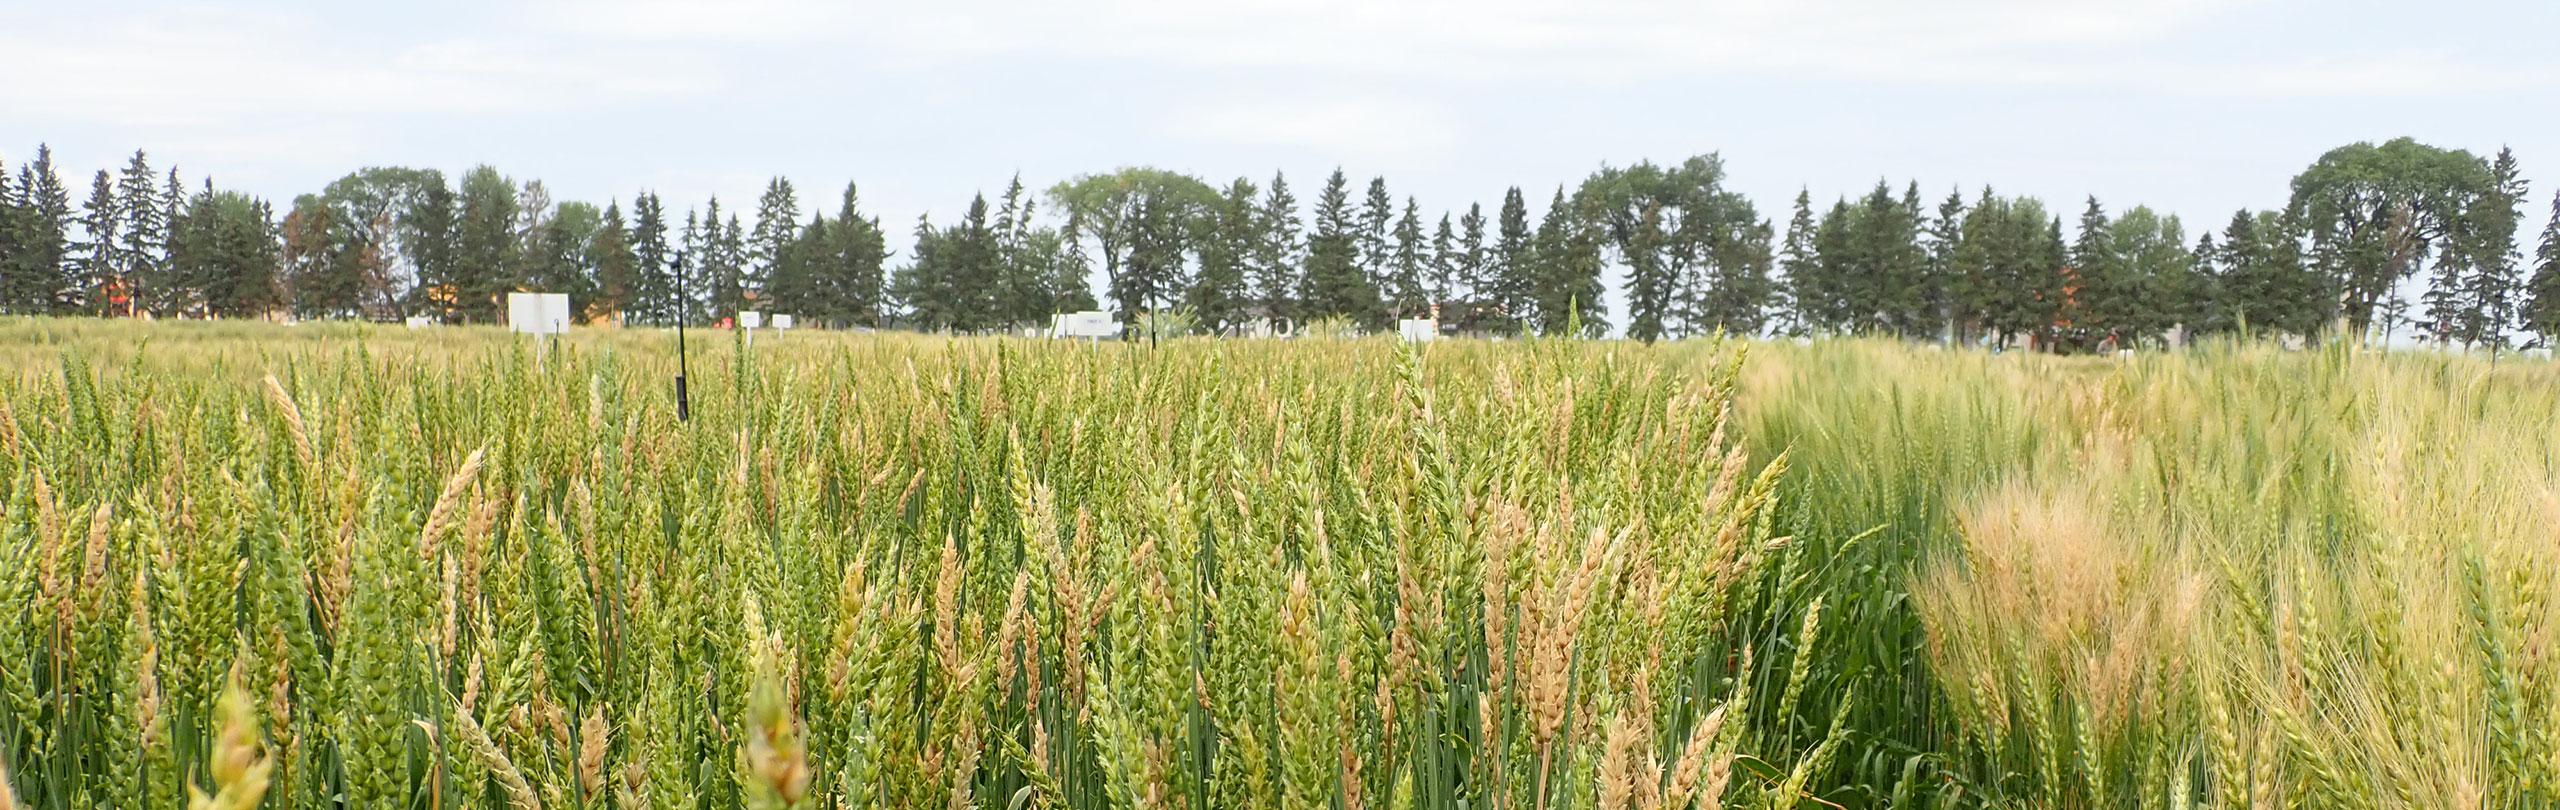
Prairie canola growth stages for 2025 are variable depending on the Province, region, and seeding date. In many regions crops are moving from the rosette stage to stem elongation or are beginning to flower.
- For wetter regions, conditions have been favourable for germination of sclerotia and production of apothecia over the last 1-2 weeks (Figures 5 and 6)
- Typically from the date of occurrence of sufficient rainfall to promote soil moisture levels near field capacity, it takes three weeks for sclerotial germination and eventual production of apothecia and ascospores
- However, if intermittent periods of rainfall occurred earlier in June, preconditioning of sclerotia may have occurred. Preconditioned sclerotia may only require two weeks for germination once adequate soil moisture levels occur and persist
- Fields in areas with VMC levels of >15% that started to occur as of June 22, 2025 may start to see the appearance of apothecia
- Early seeded canola crops as of July 2, 2025 are moving into the early bloom stage and growers in areas with >15-20% VMC are encouraged to scout fields for apothecia of the stem rot fungus and to assess in-field stem rot risk. Scouting is especially important where crop canopies have covered the soil surface for at least 2-3 weeks
- In 2006, the Canola Council of Canada and Agriculture and Agri-Food Canada co-developed a canola disease identification card that includes examples of typical stem rot pathogen apothecia along with other fungal fruiting structures that are not stem rot apothecia
- In these higher risk areas (VMC >15-20%) in-crop scouting for apothecia and the use of available stem rot risk assessment tools are recommended over the next 1-3 weeks as part of fungicide use decisions
- Tools such as the petal testing services (Service 1 and Service 2) can provide guidance related to the level of sclerotinia inoculum and stem rot risk as the crop starts flowering
- Note these need to be combined with other risk tools to provide a complete picture of stem rot risk in relation to host, pathogen and environment factors, i.e. the disease triangle.
- If fungicides are being considered, accounting for the most common crop growth stage in a field should be considered to help guide the timing(s) used
- Fortunately, most fungicide products have a window from 20-50% bloom, which represents a range of growth stages. Note available risk assessment tools will provide guidance related to stem rot risk and whether a fungicide is needed from 20-50% bloom
- On June 26, 2024, a new web-based tool from the Canola Council of Canada was announced that considers host, pathogen and weather related stem rot risk factors as well as a component that evaluates ROIs based on input costs, projected yields and commodity price. More information on the tool can be found at the Canola Council of Canada, along with the online tool itself
- The Canola Council of Canada’s seasonal Canola Watch series provides timely information in terms of sclerotinia risk assessment and fungicide timing
- The June 25, 2025 issue of Canola Watch provides some useful tips as we start into the 2025 sclerotinia season for canola
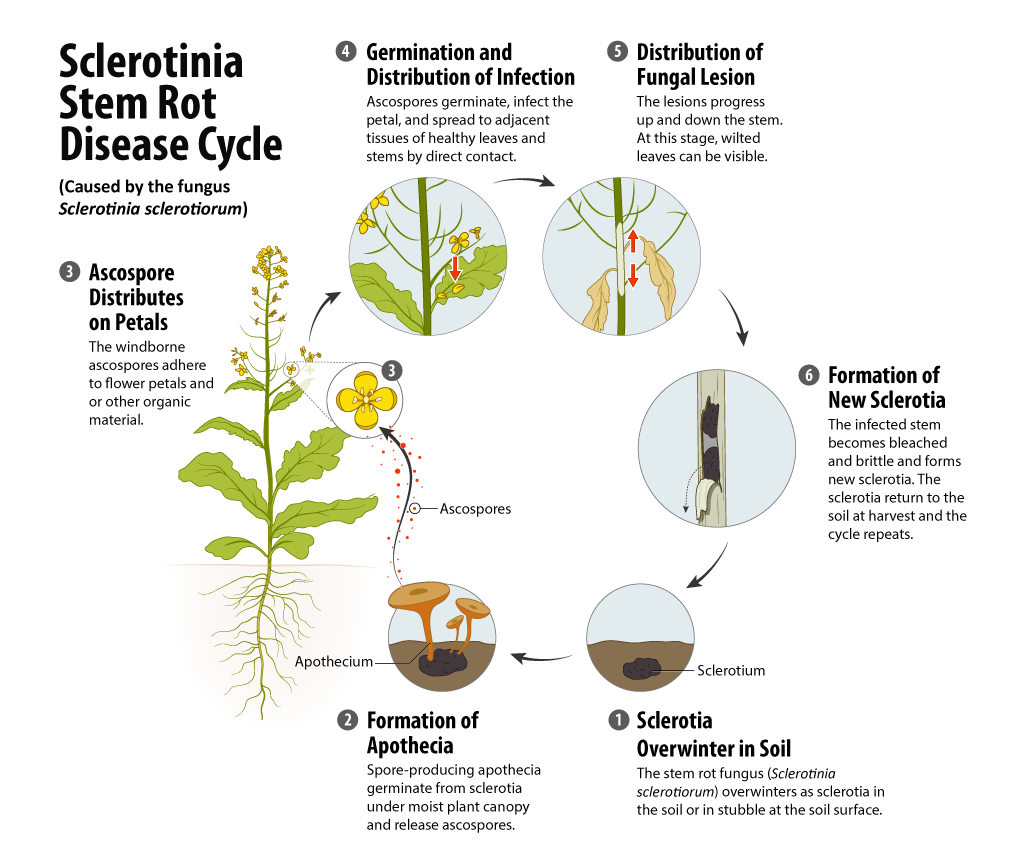
Figure 1. Disease cycle of sclerotinia stem rot of canola. Courtesy of Taryn Dickson, Resource Manager, Crop Production and Innovation and the Canola Council of Canada